StackedArea (Component)
The StackedArea component takes an array of Points[] as points, a y0 point, a colors array, an areaOptions render prop to customize each layer, and some options for styling/animating, and returns a Skia Path element which draws the stacked area chart.
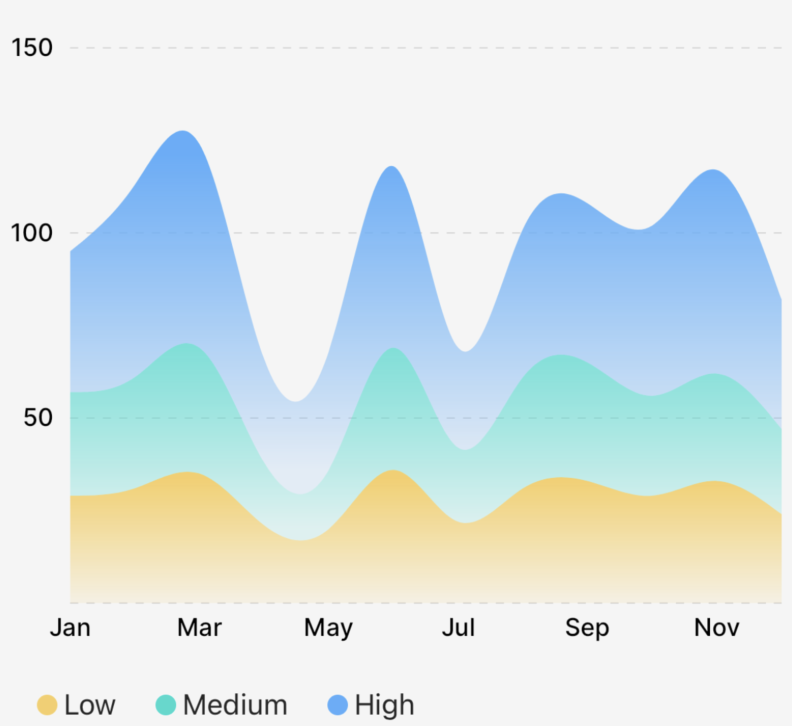
The example app inside this repo has a lot of examples of how to use the StackedArea chart and its associated components and props!
Example
import { CartesianChart, StackedArea } from "victory-native";
import { DashPathEffect, LinearGradient } from "@shopify/react-native-skia";

const generateData = () =>
  Array.from({ length: 12 }, (_, index) => {
    const low = Math.round(20 + 20 * Math.random());
    const med = Math.round(low - 5 * Math.random());
    const high = Math.round(low + 3 + 20 * Math.random());

    return {
      month: new Date(2020, index).toLocaleString("default", {
        month: "short",
      }),
      low,
      med,
      high,
    };
  });

export function MyChart() {
  const [data] = useState(DATA(4));
  return (
    <CartesianChart
      data={data}
      xKey="month"
      yKeys={["low", "med", "high"]}
      padding={8}
      domain={{ y: [0, 150] }}
      domainPadding={{ top: 0 }}
      xAxis={{
        font,
        labelOffset: 4,
        lineWidth: 0,
      }}
      yAxis={[
        {
          labelOffset: 8,
          font,
          linePathEffect: <DashPathEffect intervals={[4, 4]} />,
        },
      ]}
      onChartBoundsChange={({ left, right, top, bottom }) => {
        setW(right - left);
        setH(bottom - top);
      }}
    >
      {({ points, chartBounds }) => (
        <>
          <StackedArea
            points={[points.low, points.med, points.high]}
            y0={chartBounds.bottom}
            curveType="natural"
            animate={{ type: "spring" }}
            areaOptions={({ rowIndex, lowestY, highestY }) => {
              switch (rowIndex) {
                case 0:
                  return {
                    children: (
                      <LinearGradient
                        start={vec(0, highestY - 25)}
                        end={vec(0, lowestY)}
                        colors={["#f7ce64", "#f7ce6420"]}
                      />
                    ),
                  };
                case 1:
                  return {
                    children: (
                      <LinearGradient
                        start={vec(0, highestY - 100)}
                        end={vec(0, lowestY)}
                        colors={["#22dacd", "#22dacd20"]}
                      />
                    ),
                  };
                case 2:
                  return {
                    children: (
                      <LinearGradient
                        start={vec(0, highestY - 100)}
                        end={vec(0, lowestY)}
                        colors={["#56aefb", "#56aefb20"]}
                      />
                    ),
                  };
                default:
                  return {};
              }
            }}
          />
        </>
      )}
    </CartesianChart>
  );
}
Props
points
An array of PointsArrays that comes from the fields of the points object, as illustrated in the example above. You need to specify each key; you can't just do points={[...points]}.
y0
A number that indicates where the "bottom" of the area path should run. This number should be in canvas coordinates.
animate
The animate prop takes a PathAnimationConfig object and will animate the path when the points change.
colors
The colors prop takes an array of Color values to use for the layers. The order of the colors should match the order of the points prop.
curveType
A CurveType value that indicates the type of curve should be drawn (e.g. linear or natural).
areaOptions
The areaOptions prop is a render function with a signature like this:
type CustomizablePathProps = Partial<
  Pick<PathProps, "color" | "blendMode" | "opacity" | "antiAlias">
>;
areaOptions?: ({
    rowIndex,
    lowestY,
    highestY,
  }: {
    rowIndex: number; // the index of the layer
    lowestY: number; // the lowest Y value for this layer
    highestY: number; // the highest Y value for this layer
  }) => CustomizablePathProps & {
    children?: React.ReactNode;
  };
This prop allows you to customize each individual layer in the stacked area chart. You can use this to customize the children of each areas as well, allowing for things like LinearGradients, etc. See the example repo for more information.